Been there, done that. Debugging is sort of the least fun thing to do when it comes to developing software. The underlying issue we’re facing is unexpected behavior in the code.
There are various ways to find the issue and fix it. Sometimes it’s an easy typo, some other times it is a complicated and entangled problem on various levels that cause the issue we’re seeing. In this post I’ll show a method to analyze a big set of data with IntelliJ debug mode.
The Approach
The shown example is common for processing lots of data with various different attributes in your application. When seeing issues with a sorting or filtering algorithm, it makes most sense to have a look at the entire data set.
For this example we create a simple java.lang.List of Person.
1 | class Person { |
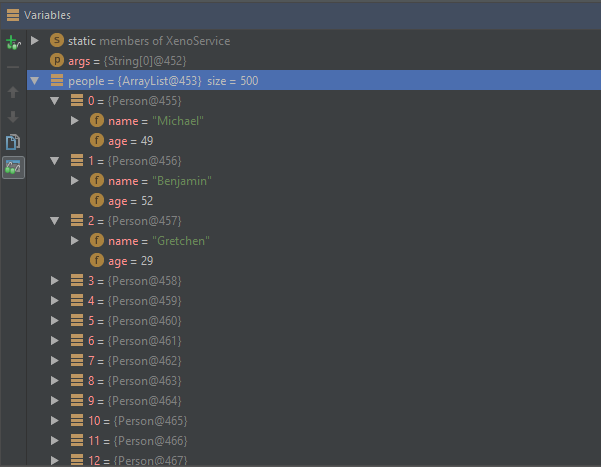
To get a dump of the current content of the list we set a breakpoint somewhere after we fill the list with test data.

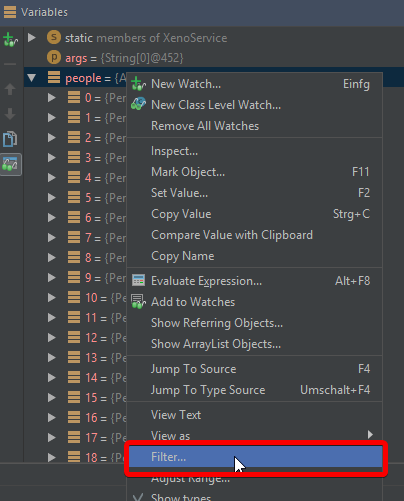
By right-clicking on the object, here the ArrayList, we can add a “Filter” to it.

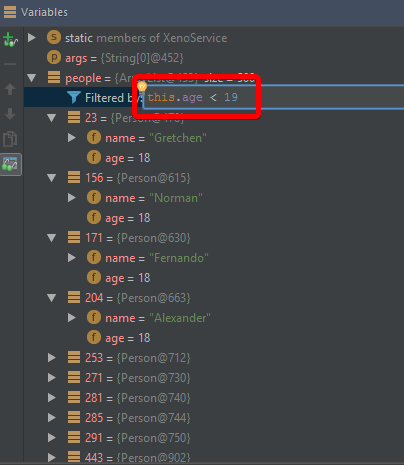
The text window lets you enter any sort of code to filter the collection, such as >, <, ==, != and more.

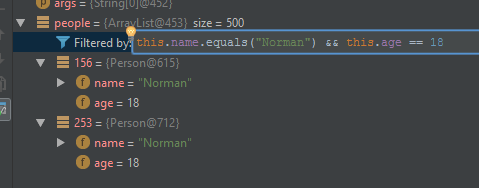
You can also chain certain conditions to get even more filtered data.

This is only one of many extremely powerful tools IntelliJ IDEA offers to debug code to find issues and unwanted behaviors in the code.